Replace Anypoint Monitoring with Grafana + Prometheus

Anypoint Monitoring only sees Mule applications. Grafana and Prometheus give you unified observability across your entire infrastructure — integrations, APIs, databases, and everything else.

What you're moving to

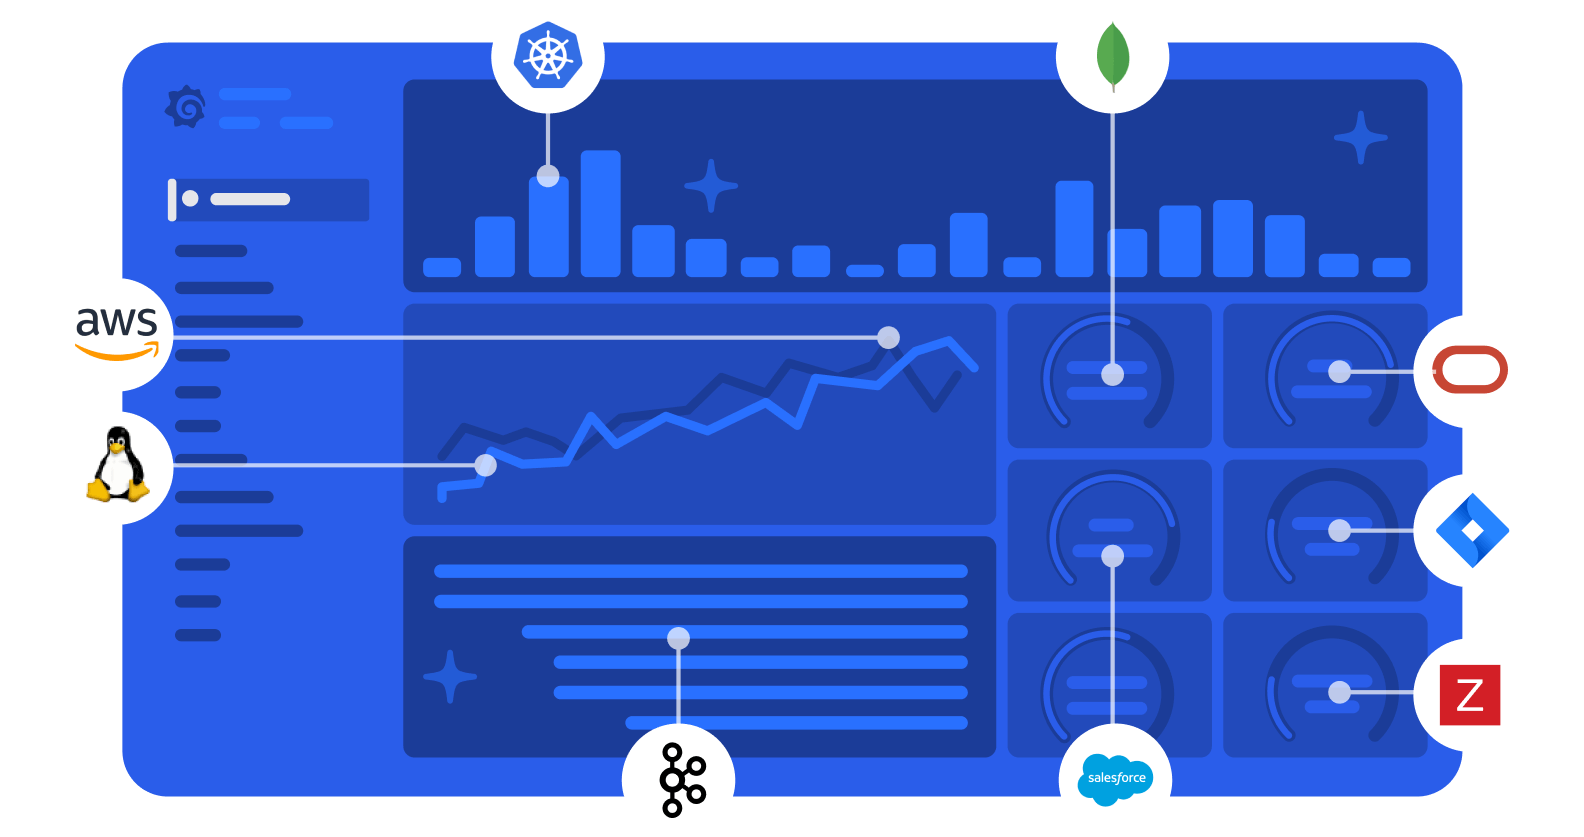
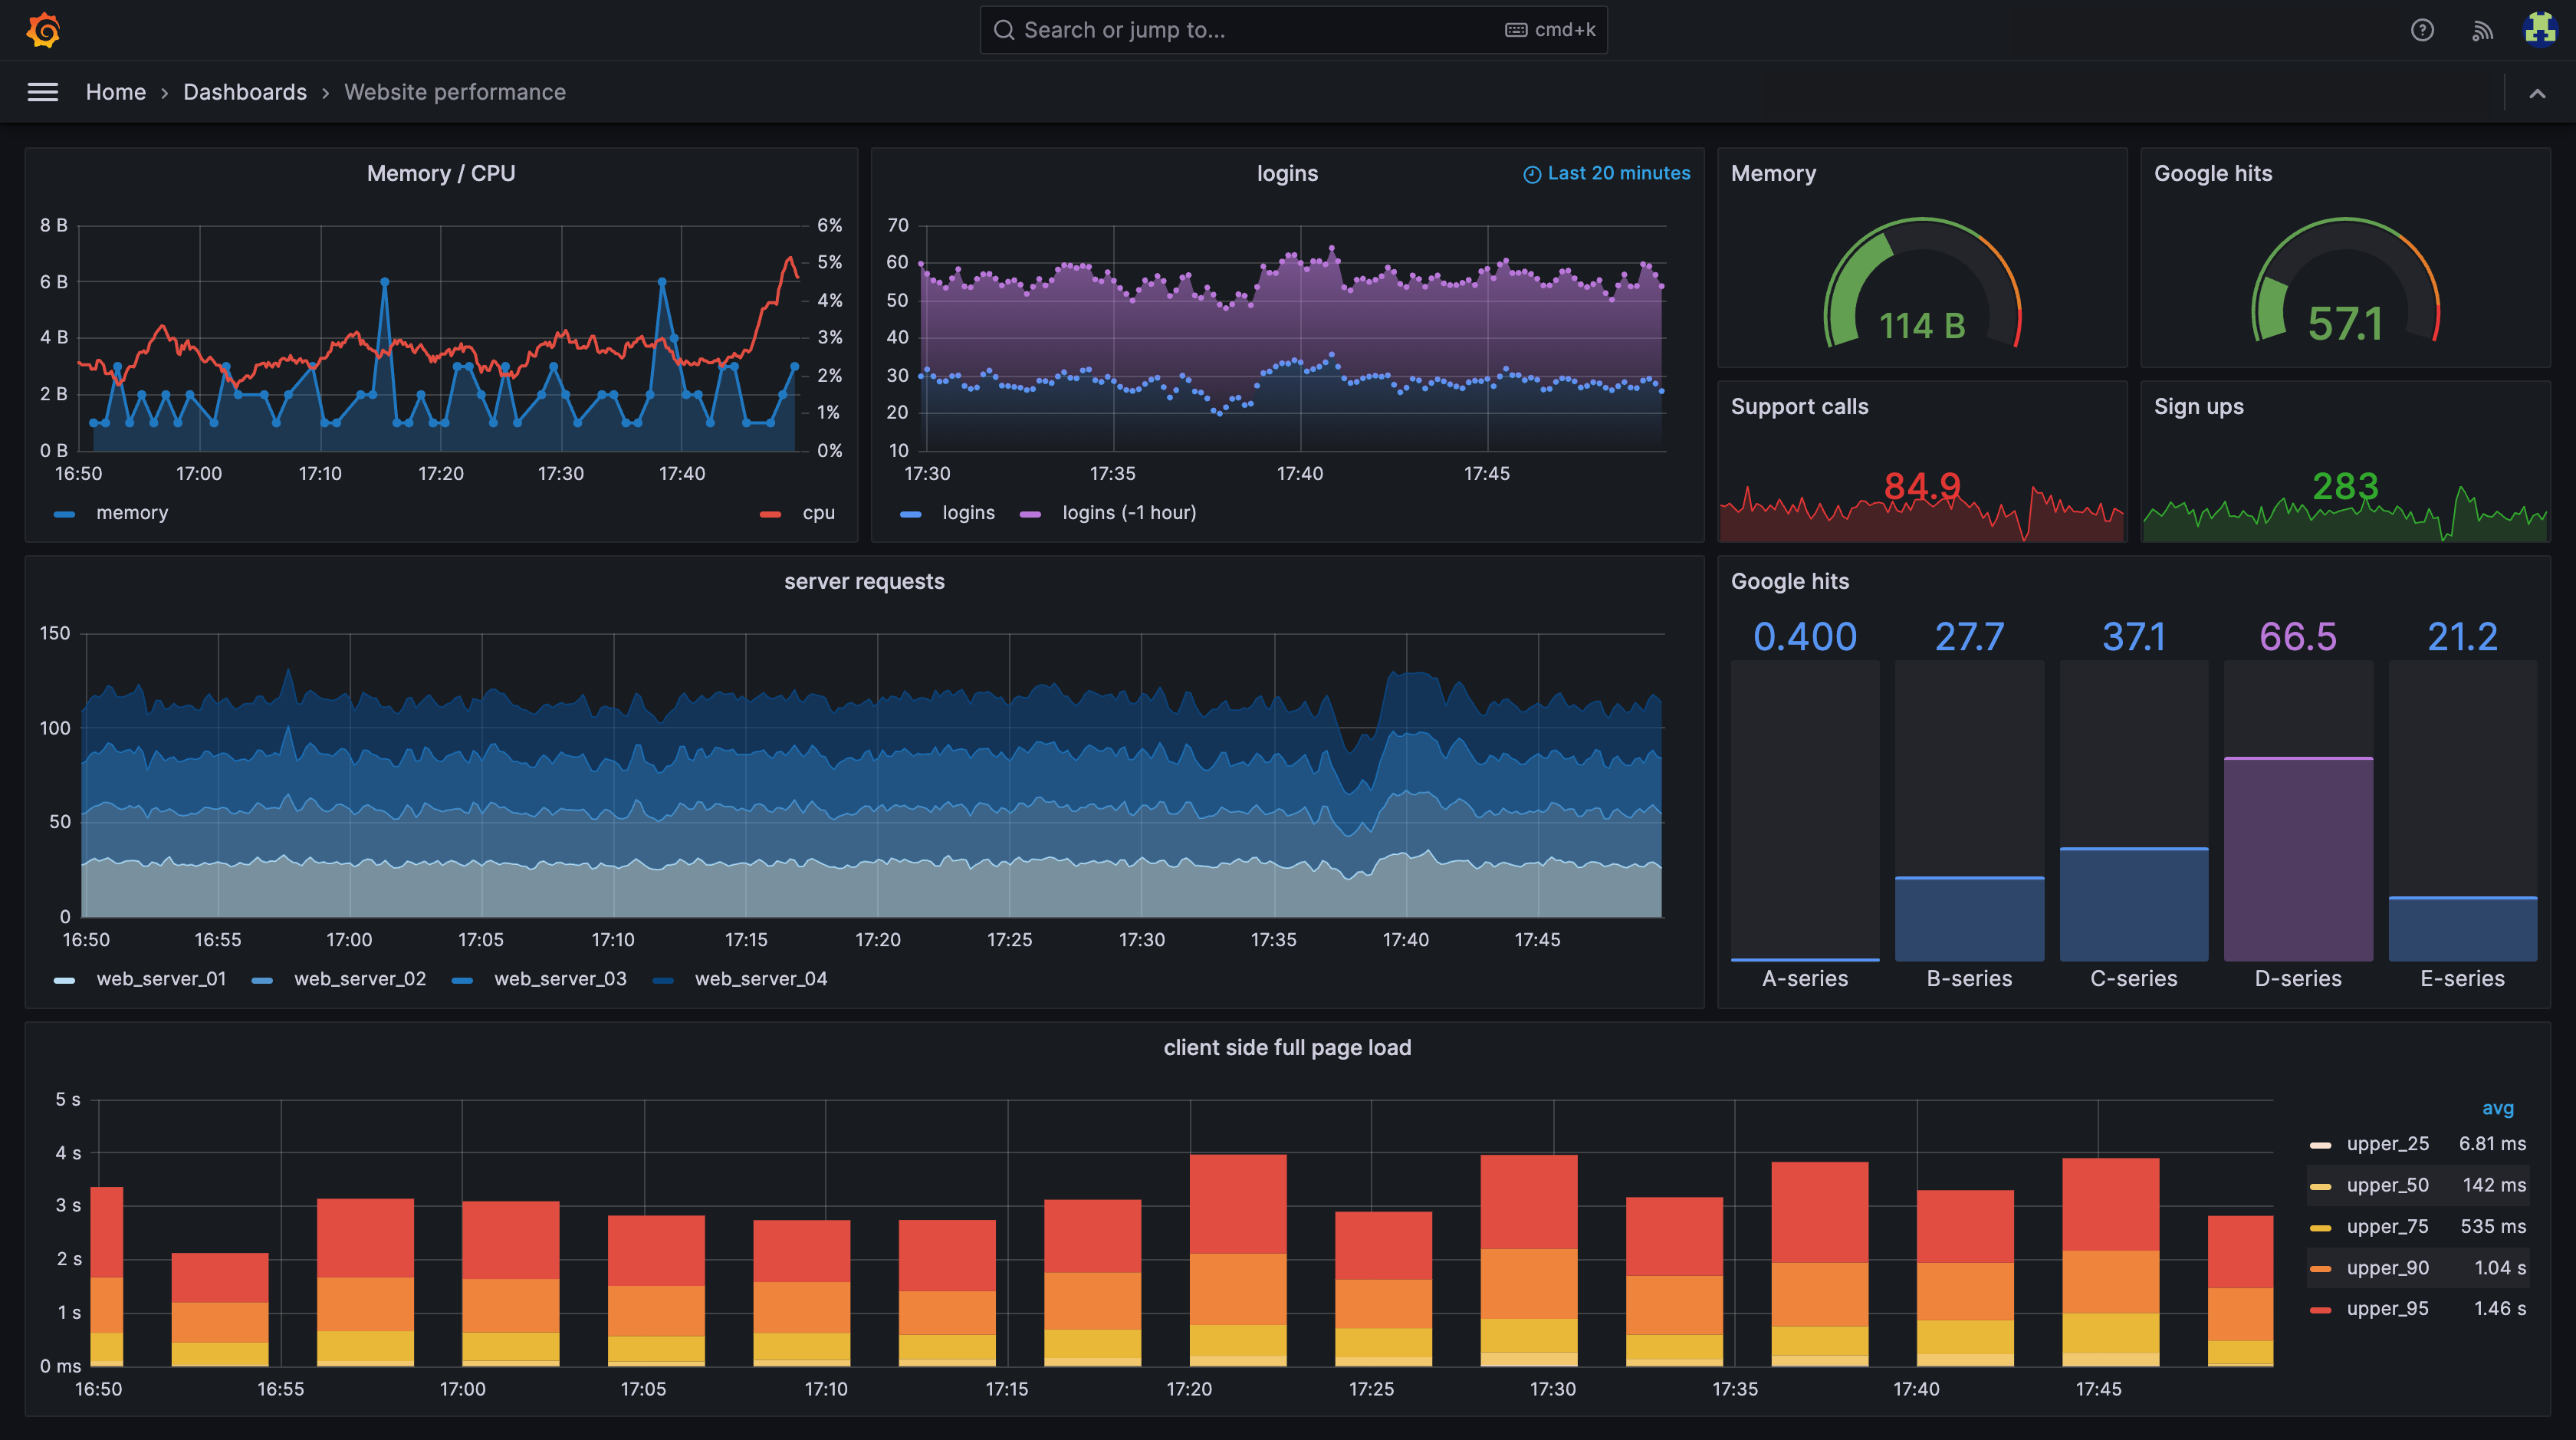
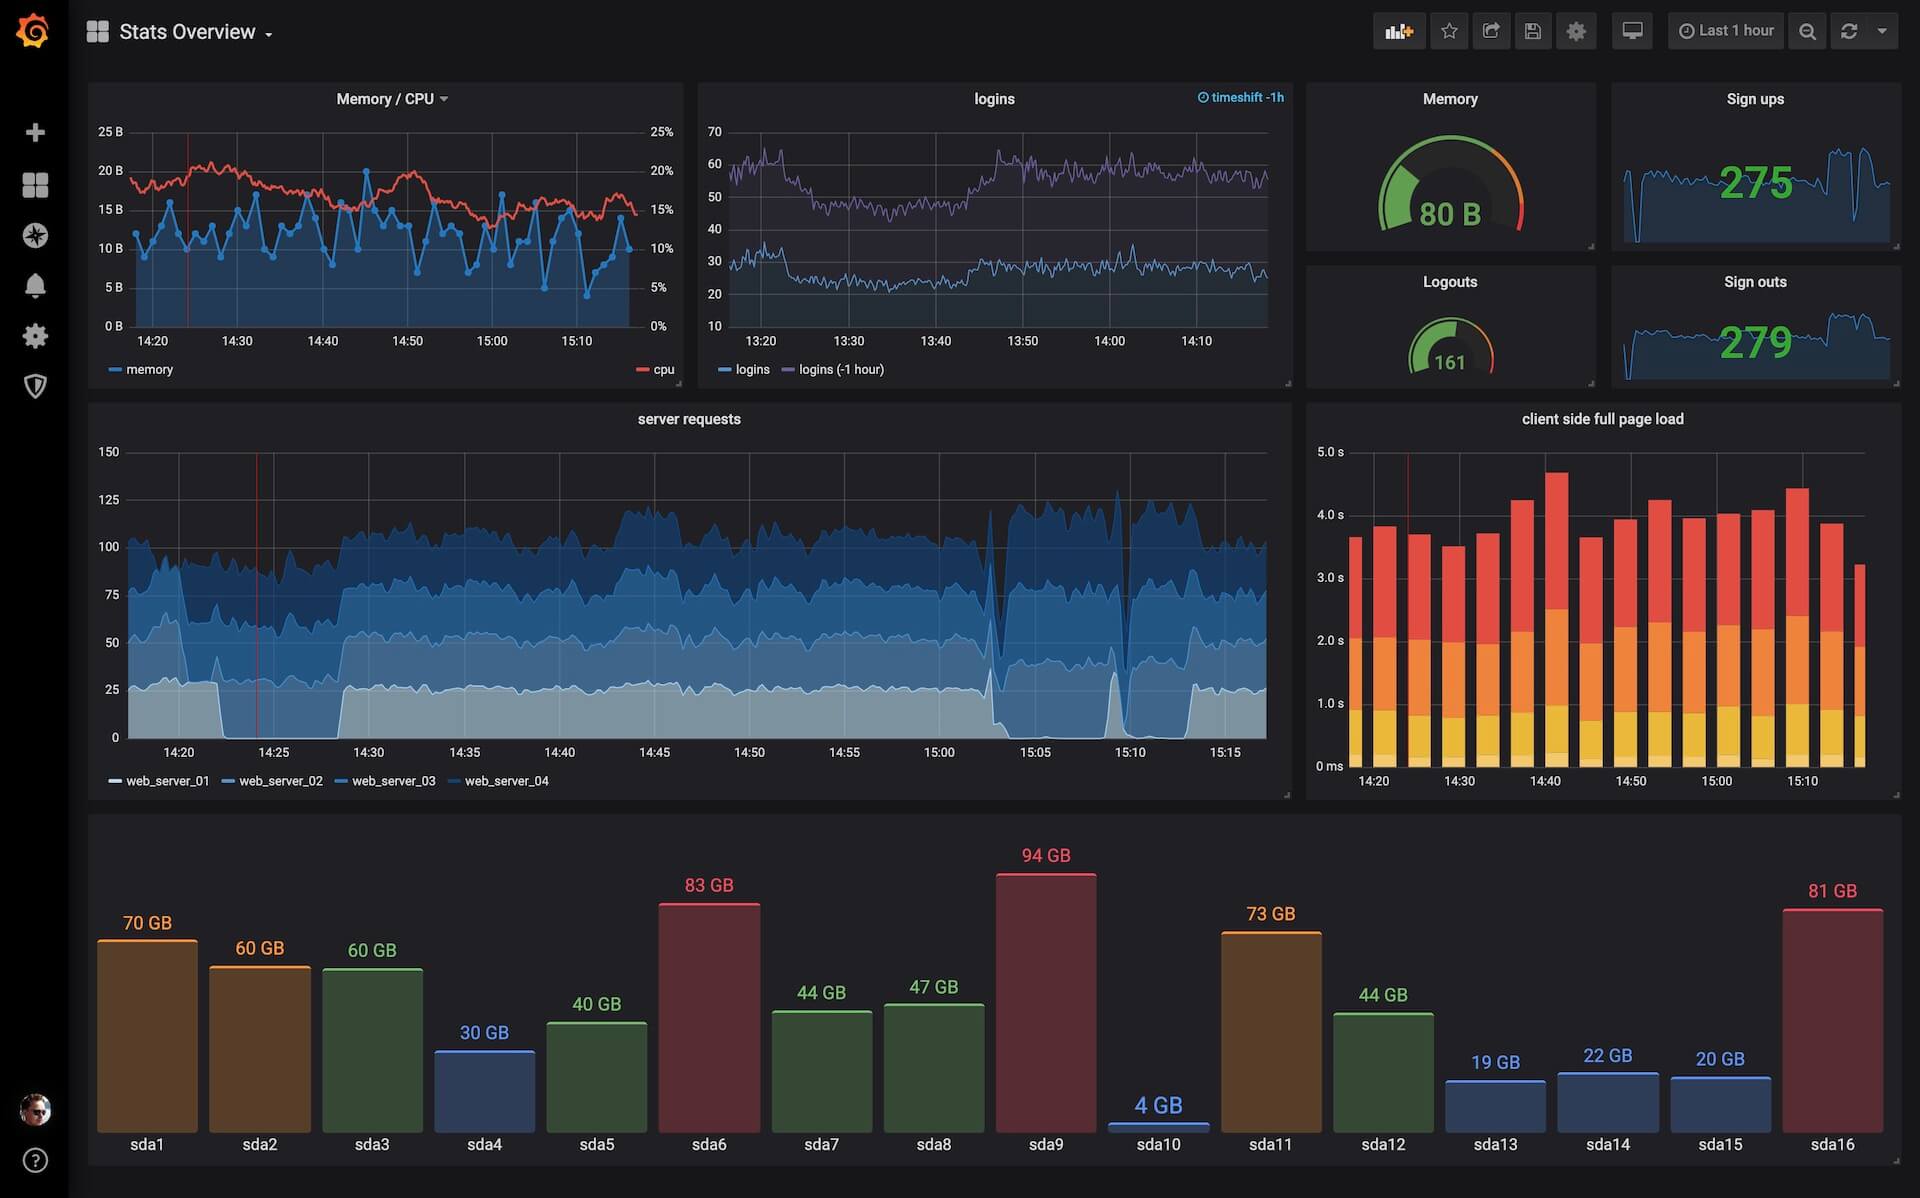
Grafana + Prometheus + OpenTelemetry

The industry standard for observability. Grafana for visualization, Prometheus for metrics collection, OpenTelemetry for distributed tracing. Monitor everything, not just your integrations.

Advantages over Anypoint Monitoring

✕ Only monitors Mule applications
✓ Monitor your entire stack — APIs, databases, infrastructure, everything
✕ Dashboard customization limited to Anypoint UI
✓ Grafana: unlimited dashboards, panels, and data sources
✕ Retention and alerting tied to platform tier
✓ You control retention, alerting rules, and notification channels
✕ Closed ecosystem — no third-party integrations
✓ OpenTelemetry standard — works with any observability vendor

Full-stack observability

Grafana dashboards

Beautiful, customizable dashboards for every metric you care about. Route throughput, error rates, latency percentiles, JVM stats — build exactly what your team needs.

Prometheus metrics

Camel + Spring Boot expose metrics via Micrometer out of the box. Prometheus scrapes them automatically. Alerting rules trigger PagerDuty, Slack, or email when things go wrong.

Distributed tracing

OpenTelemetry traces requests across services. See exactly where time is spent as a message flows through your integration routes. No more guessing.

One pane of glass

Unlike Anypoint Monitoring, Grafana sees everything — your integrations, your APIs, your databases, your infrastructure. One platform, not a silo.

See everything. Not just your Mule apps.

We'll set up monitoring that covers your entire stack, not just the integration layer.

Book a Free Assessment